One of the best ways for any business to grow is by keeping up-to-date with what’s going on in the industry. This is especially true for fast-moving industries, such as SaaS. It’s vital to see what strategies are working for other companies as well as the tactics that are falling flat.
Of course, there are plenty of people offering different opinions. By looking at the actual statistics though, you can get a more accurate picture of what’s working (and what isn’t). That’s why we’ve collected the most relevant statistics covering growth, churn, and sales for SaaS companies. To make things easier, we’ve put them together a SaaS report in a handy infographic for you, along with the key takeaways you need to know.
Scroll down to discover:
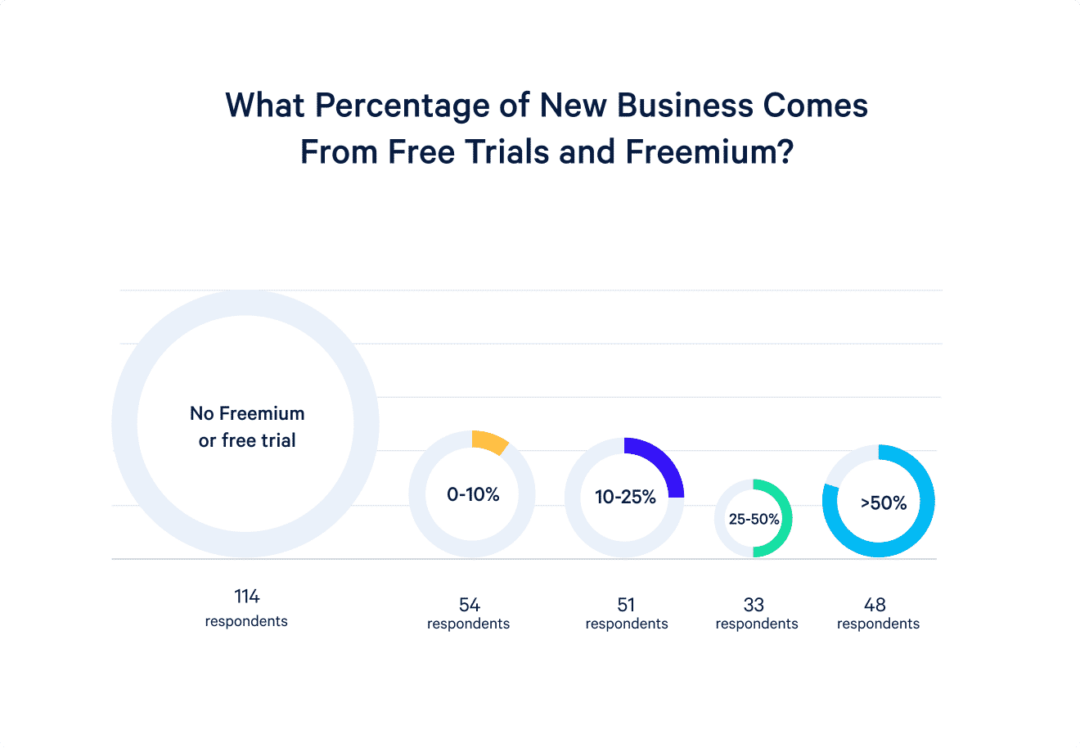
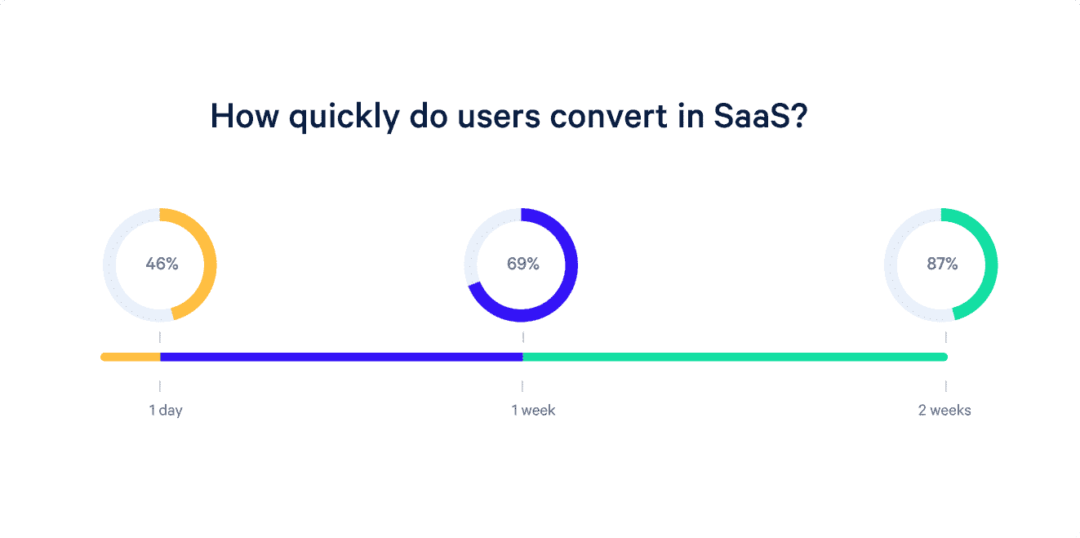
- How effective free trials are
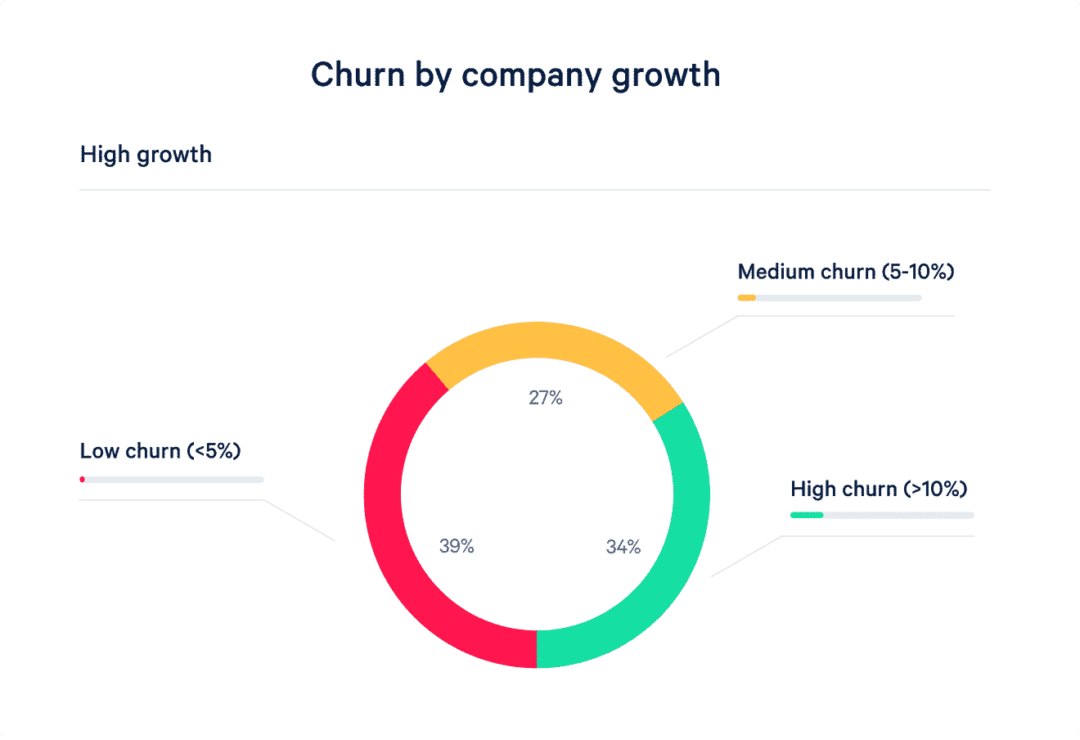
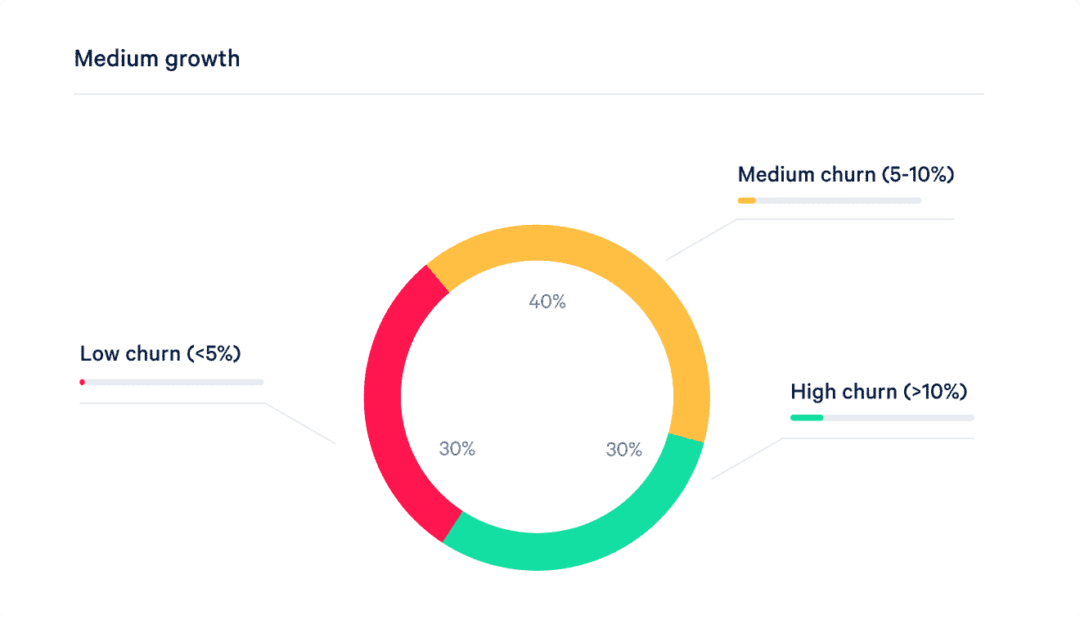
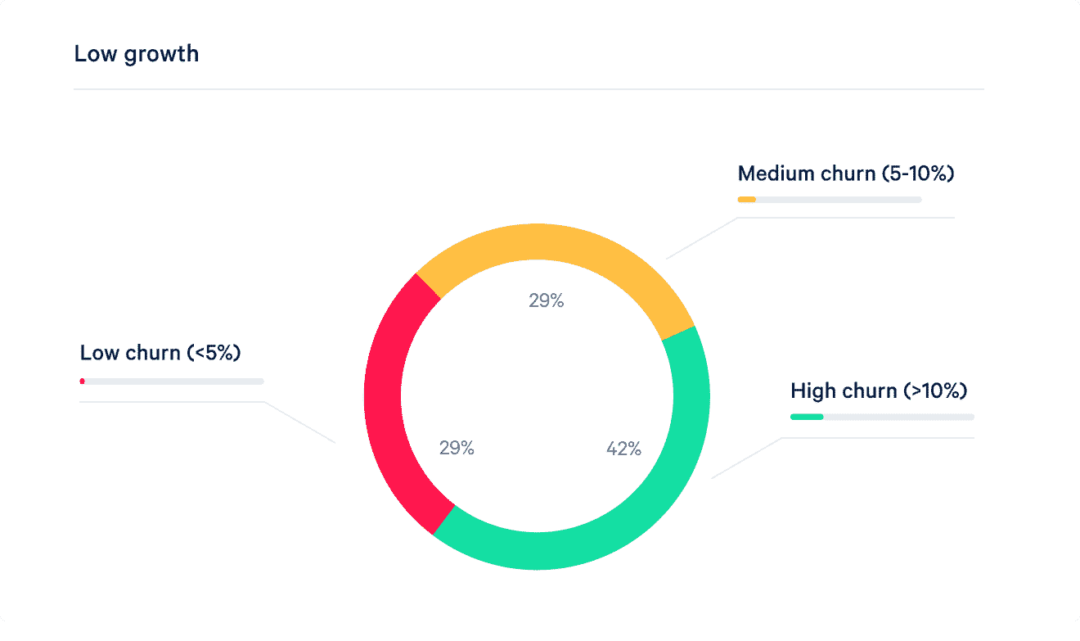
- How growth rate effects churn
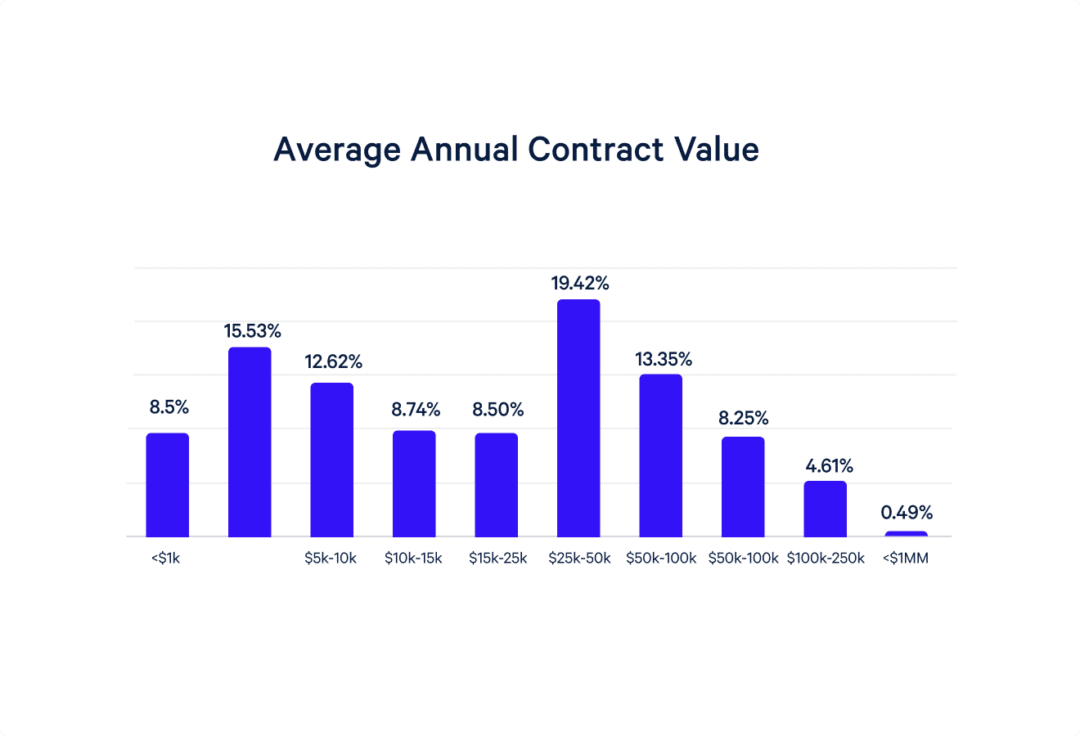
- The average annual contract value and plenty more
SAAS GROWTH STATISTICS
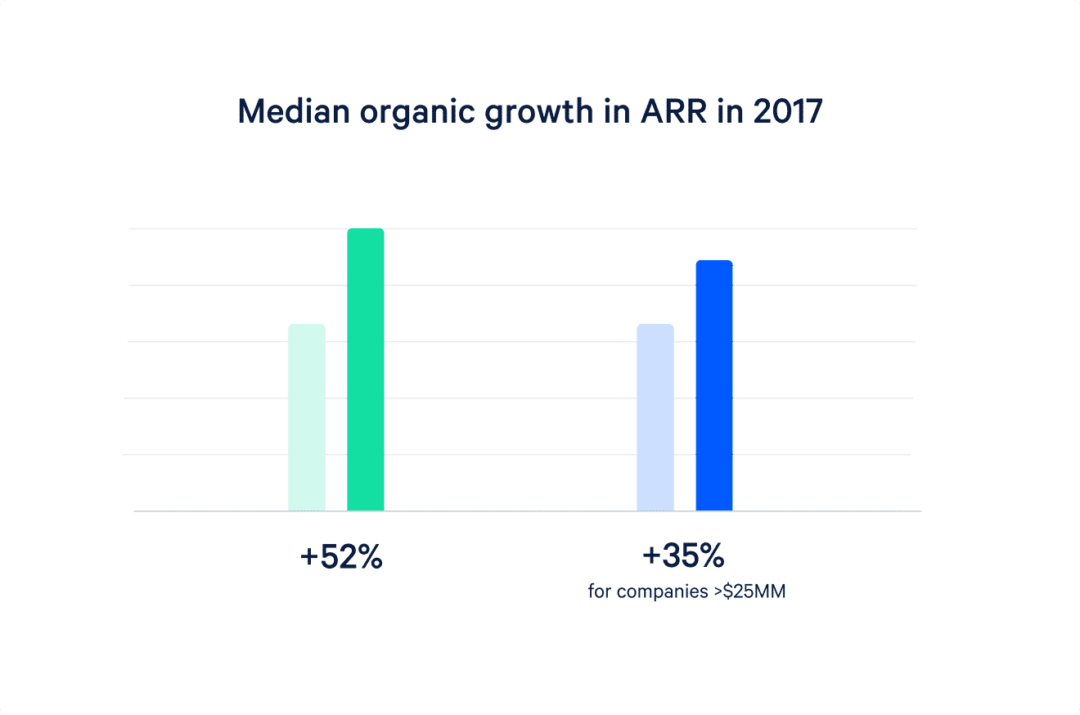
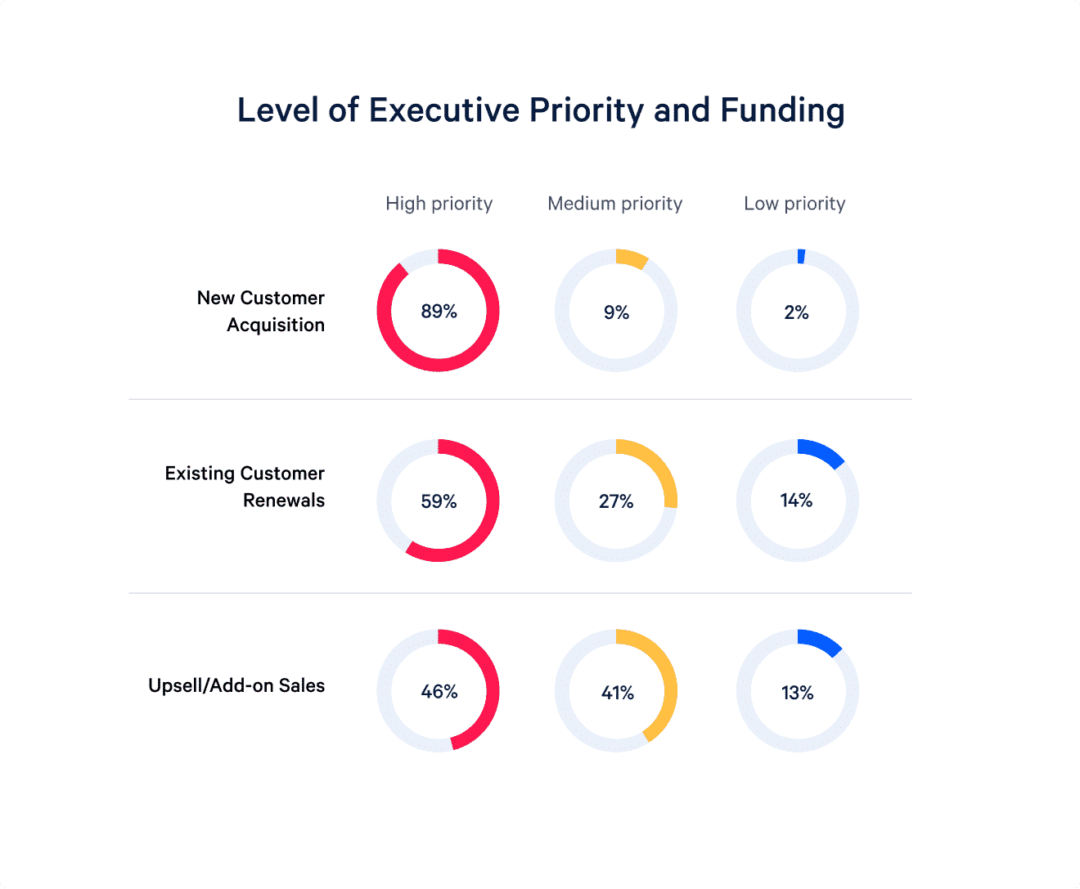
First, we wanted to get a clear picture of how successful SaaS companies are growing. What are their priorities, and how effective are they?